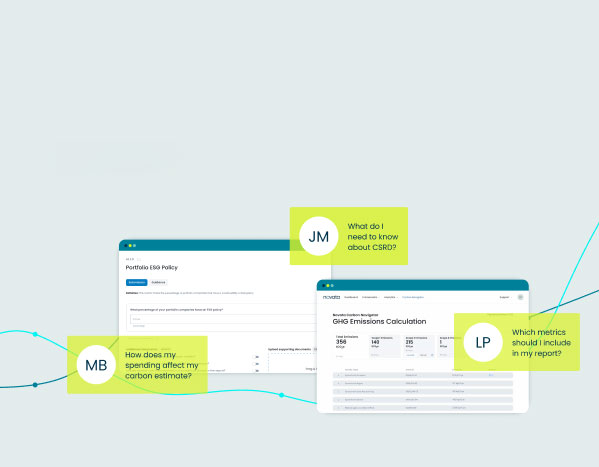


On a firm’s sustainability journey, environmental, social, and governance (ESG) data is crucial in informing the strategies that drive value. However, once GPs have successfully collected data from portfolio companies, the next challenge lies in understanding how to use it. At Novata, we support GPs on this journey from collection to action by making it easy to visualize, analyze, and compare ESG data against benchmarks to generate insights and engage stakeholders. To help GPs better navigate the post-data collection journey, we’ve identified three pathways for leveraging the insights derived from their ESG data. Below, we explore these pathways with examples from Novata’s data analysis and visualization tool.
- Firm Strategy & Analysis
- Portfolio Company Engagement
- External Reporting & Engagement
Firm Strategy & Analysis
Following data collection, one of the first steps for GPs is carving out time to understand and analyze the data at the portfolio, fund, and company levels. Incorporating ESG data into a firm’s strategy means making decisions based on a holistic understanding of the portfolio, and analyzing data at these three levels helps provide a fuller picture of performance across the portfolio and the portfolio’s relative ESG maturity. This analysis can then help identify areas of improvement, uncover potential ESG risks, and unlock opportunities for value creation. Certain ESG risks, such as cybersecurity and climate change mitigation, have become increasingly material to companies in recent years.
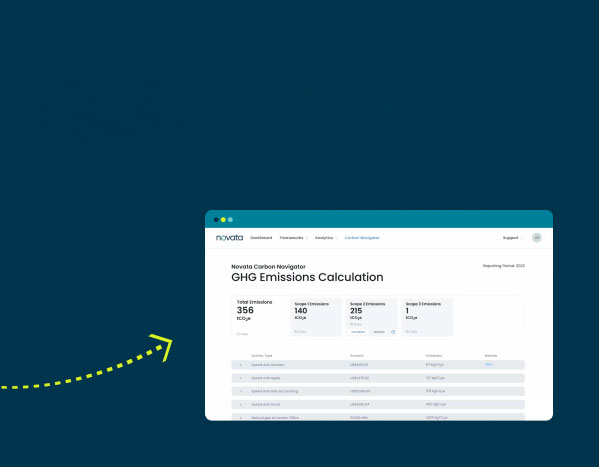
In the Novata platform, GPs can use the Dashboard Creator to understand ESG performance and risks at each level and use the information to determine action steps for engaging portfolio companies and optimizing their strategy.
For instance, say a GP wants all portfolio companies to achieve a certain baseline level of performance, such as having a cybersecurity policy. Analyzing data at the portfolio level makes it easy to identify laggards and develop a plan to help them meet the baseline requirement.
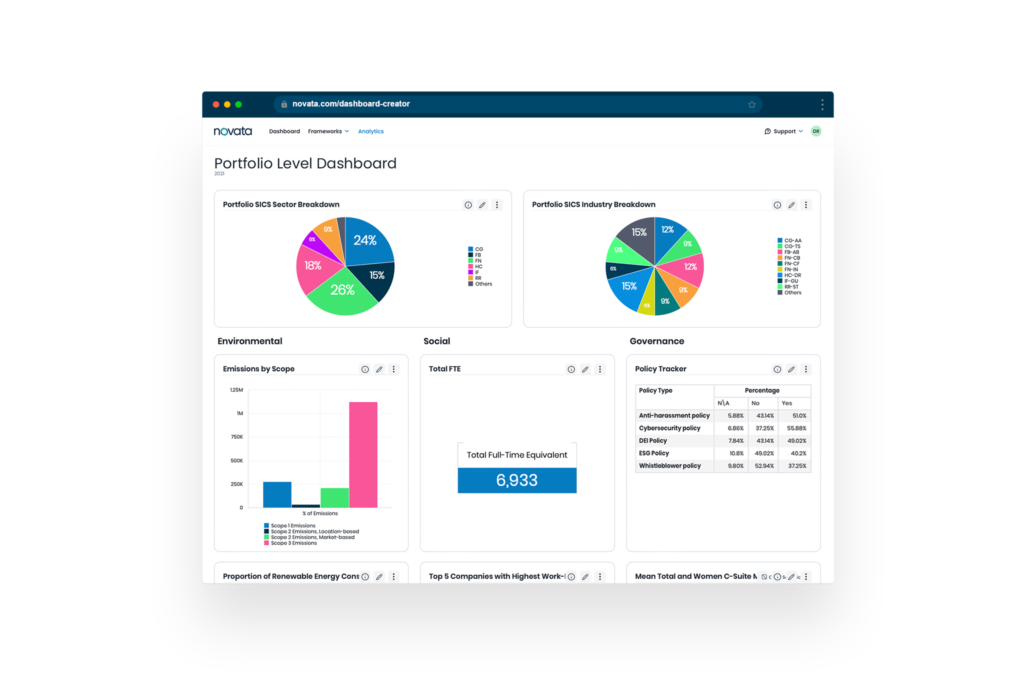
Snapshot of portfolio-level dashboard in Novata platform showing sample graphs and charts of ESG data. This dashboard visualizes key metrics aggregated for an entire portfolio from one data collection period. Helpful insights include the ‘Policy Tracker’ table, which indicates what percentage of portfolio companies have a certain policy; the top 5 companies with the highest number of work-related injuries normalized by full-time equivalent (FTE); and the top 10 highest Scope 3 emitters normalized by revenue.
Portfolio Company Engagement
Once GPs have a good understanding of performance across the portfolio, this information can inform how they engage with portfolio companies around sustainability initiatives. After collecting data from portfolio companies, keeping lines of communication open and sharing ESG strategies can help reinforce the value that data collection has for both the firm and portfolio companies. This also helps cultivate buy-in from the portfolio company because they understand why the data is being requested and how it will be used.
For instance, GPs often share key findings with portfolio companies, such as year-over-year trends, comparisons to benchmarks, and portfolio averages, to underscore the importance of collecting ESG data. This information can help with understanding the companies’ needs, setting data-backed targets, aligning firm and company priorities, communicating progress on key initiatives, and managing risk. Incorporating this data can strengthen a firm’s engagement strategy around ESG with clearer priorities and shared understanding around the value of these initiatives.
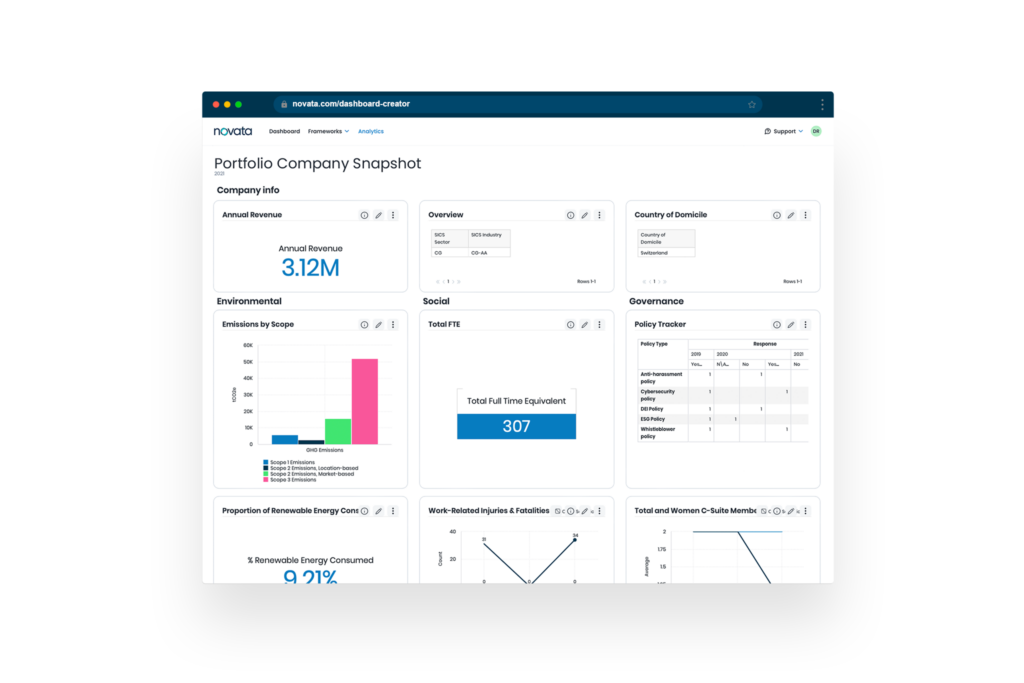
Snapshot from the Novata platform showing an overview of portfolio company ESG data. This dashboard is a snapshot of an individual portfolio company’s ESG data in a given reporting period, with some metrics visualized over multiple years to show changes in performance. Helpful insights include a breakdown of GHG emissions by scope, which can be used in the early steps of hotspot analysis; ‘Policy Tracker’ to show which policies the company has in place; and the number of work-related fatalities and injuries over three years.
External Reporting & Engagement
When reporting externally, the business’ ability to provide high-quality data and data-backed insights is critical to ensuring accuracy and demonstrating commitment and progress over time. Visualizing this data during the analysis stage can make it easy to identify gaps in data collection and track progress to identify areas to improve data quality and performance over time.
GPs are receiving an increasing number of ESG data requests from LPs while also navigating an evolving regulatory landscape with complex reporting requirements. Therefore, it can be challenging to efficiently respond to these requests and provide stakeholders with the ESG data they need. Regulatory reporting requirements vary based on multiple factors such as geography, firm size, and asset class. For example, in Europe, firms complying with the Sustainable Finance Disclosure Regulation (SFDR) will need to fulfill various disclosure requirements, including the Principal Adverse Impact (PAI) Statement. Some LPs, regardless of regulatory obligation, also ask GPs to provide a completed PAI Statement.
In the US, the ESG Data Convergence Initiative (EDCI) framework is also popular for GPs to use when reporting and covers key topics such as GHG emissions, diversity, and work-related accidents. The Dashboard Creator in the Novata platform is designed to help firms analyze data that is typically included in reports. In addition to using Novata’s API to submit these metrics directly to EDCI after collecting from portfolio companies, GPs can use the Dashboard Creator to create data visualizations and track performance. This is a good way to maximize the benefits of data collection and improve portfolio engagement by providing value back to portfolio companies.
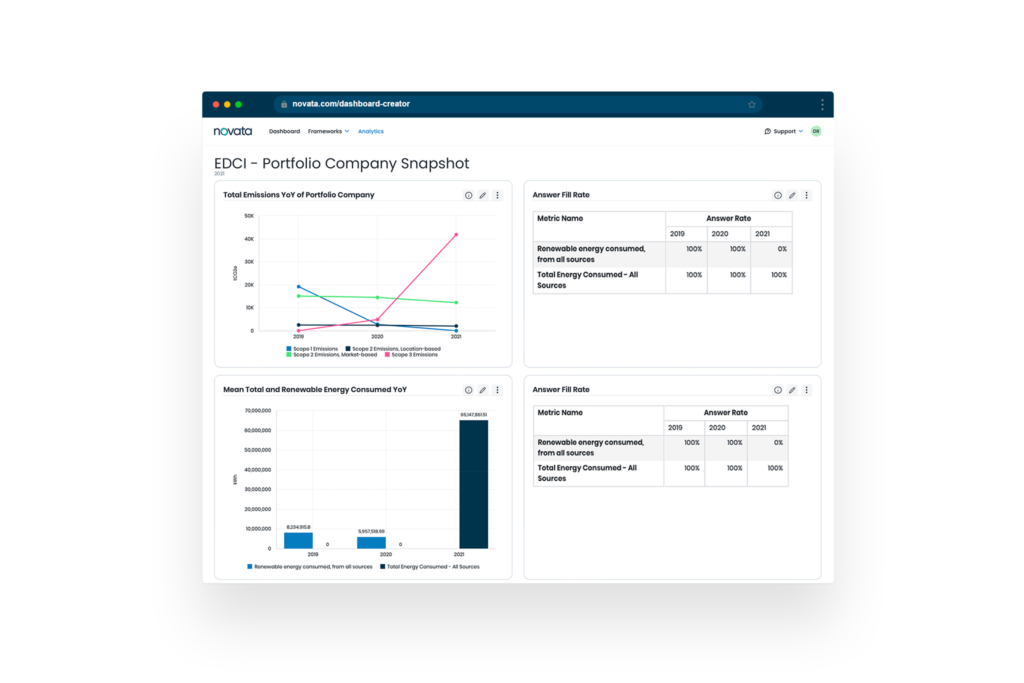
Snapshot from the Novata platform showing sample charts and graphs of portfolio company data in alignment with the ESG Data Convergence Initiative. This dashboard is a snapshot of an individual portfolio company’s responses to the EDCI framework. The EDCI framework is also available in a portfolio-level dashboard. Helpful insights include annual percent turnover year-over-year; days lost due to injury which is a measure of worker safety; and total versus renewable energy consumed.
Novata’s Dashboard Creator allows GPs to analyze and visualize the data they collect from portfolio companies and makes it easier to take the next step after data collection. Whether it is firm strategy or portfolio engagement, Novata helps GPs navigate ESG strategy post-data collection. To make it even easier, Novata also offers dedicated resources and support for the Dashboard Creator, including one-to-one support sessions with Solutions Architects. If you are interested in collecting, analyzing, or visualizing ESG data, we have the tools and expertise to help you do that. Learn more about how Novata helps investors easily access and analyze ESG data to derive actionable insights.