- Products
- Products
- FEATURES
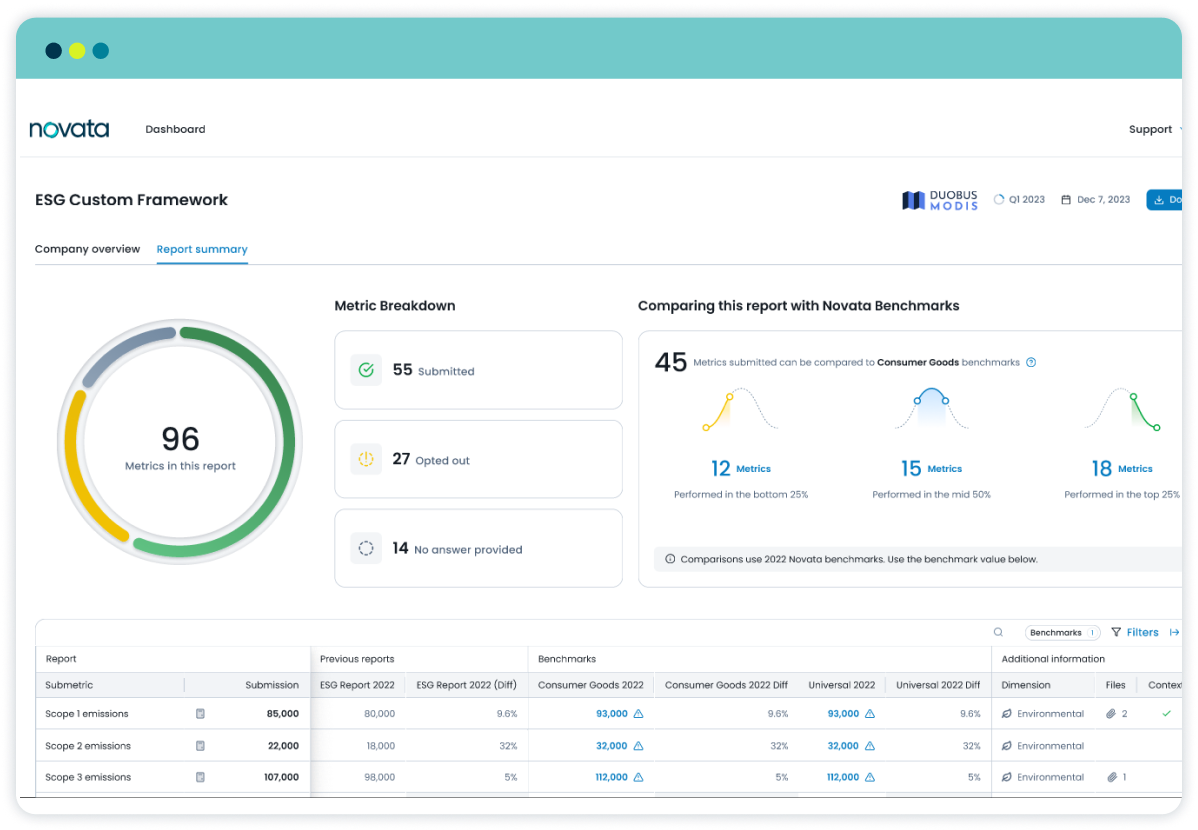
- Data ManagementTools to choose, collect, and manage ESG metrics
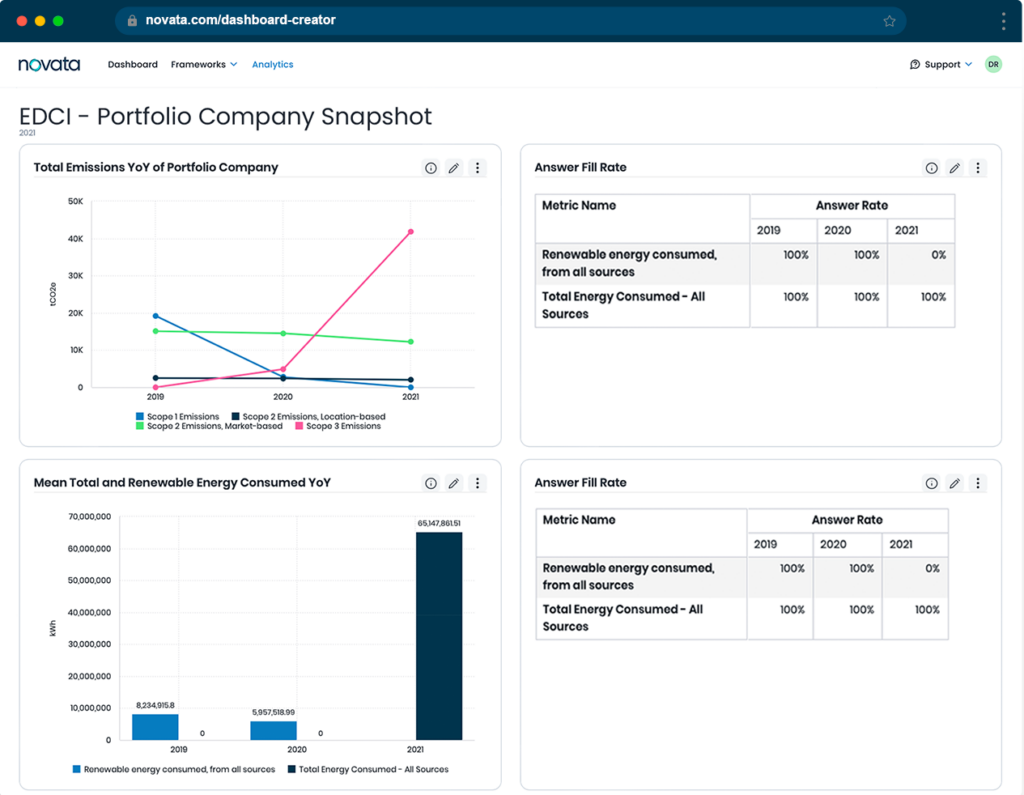
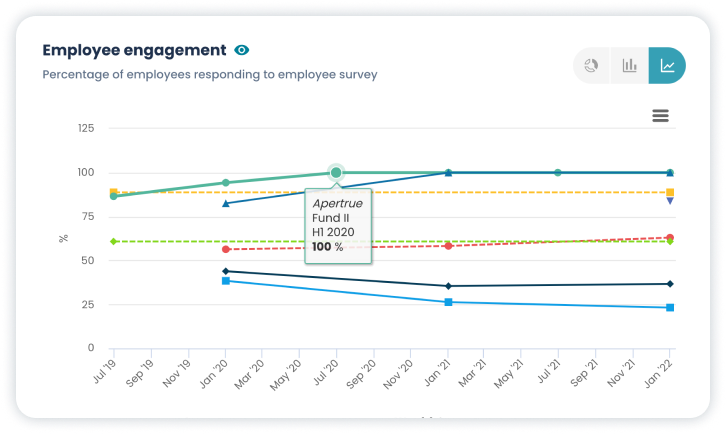
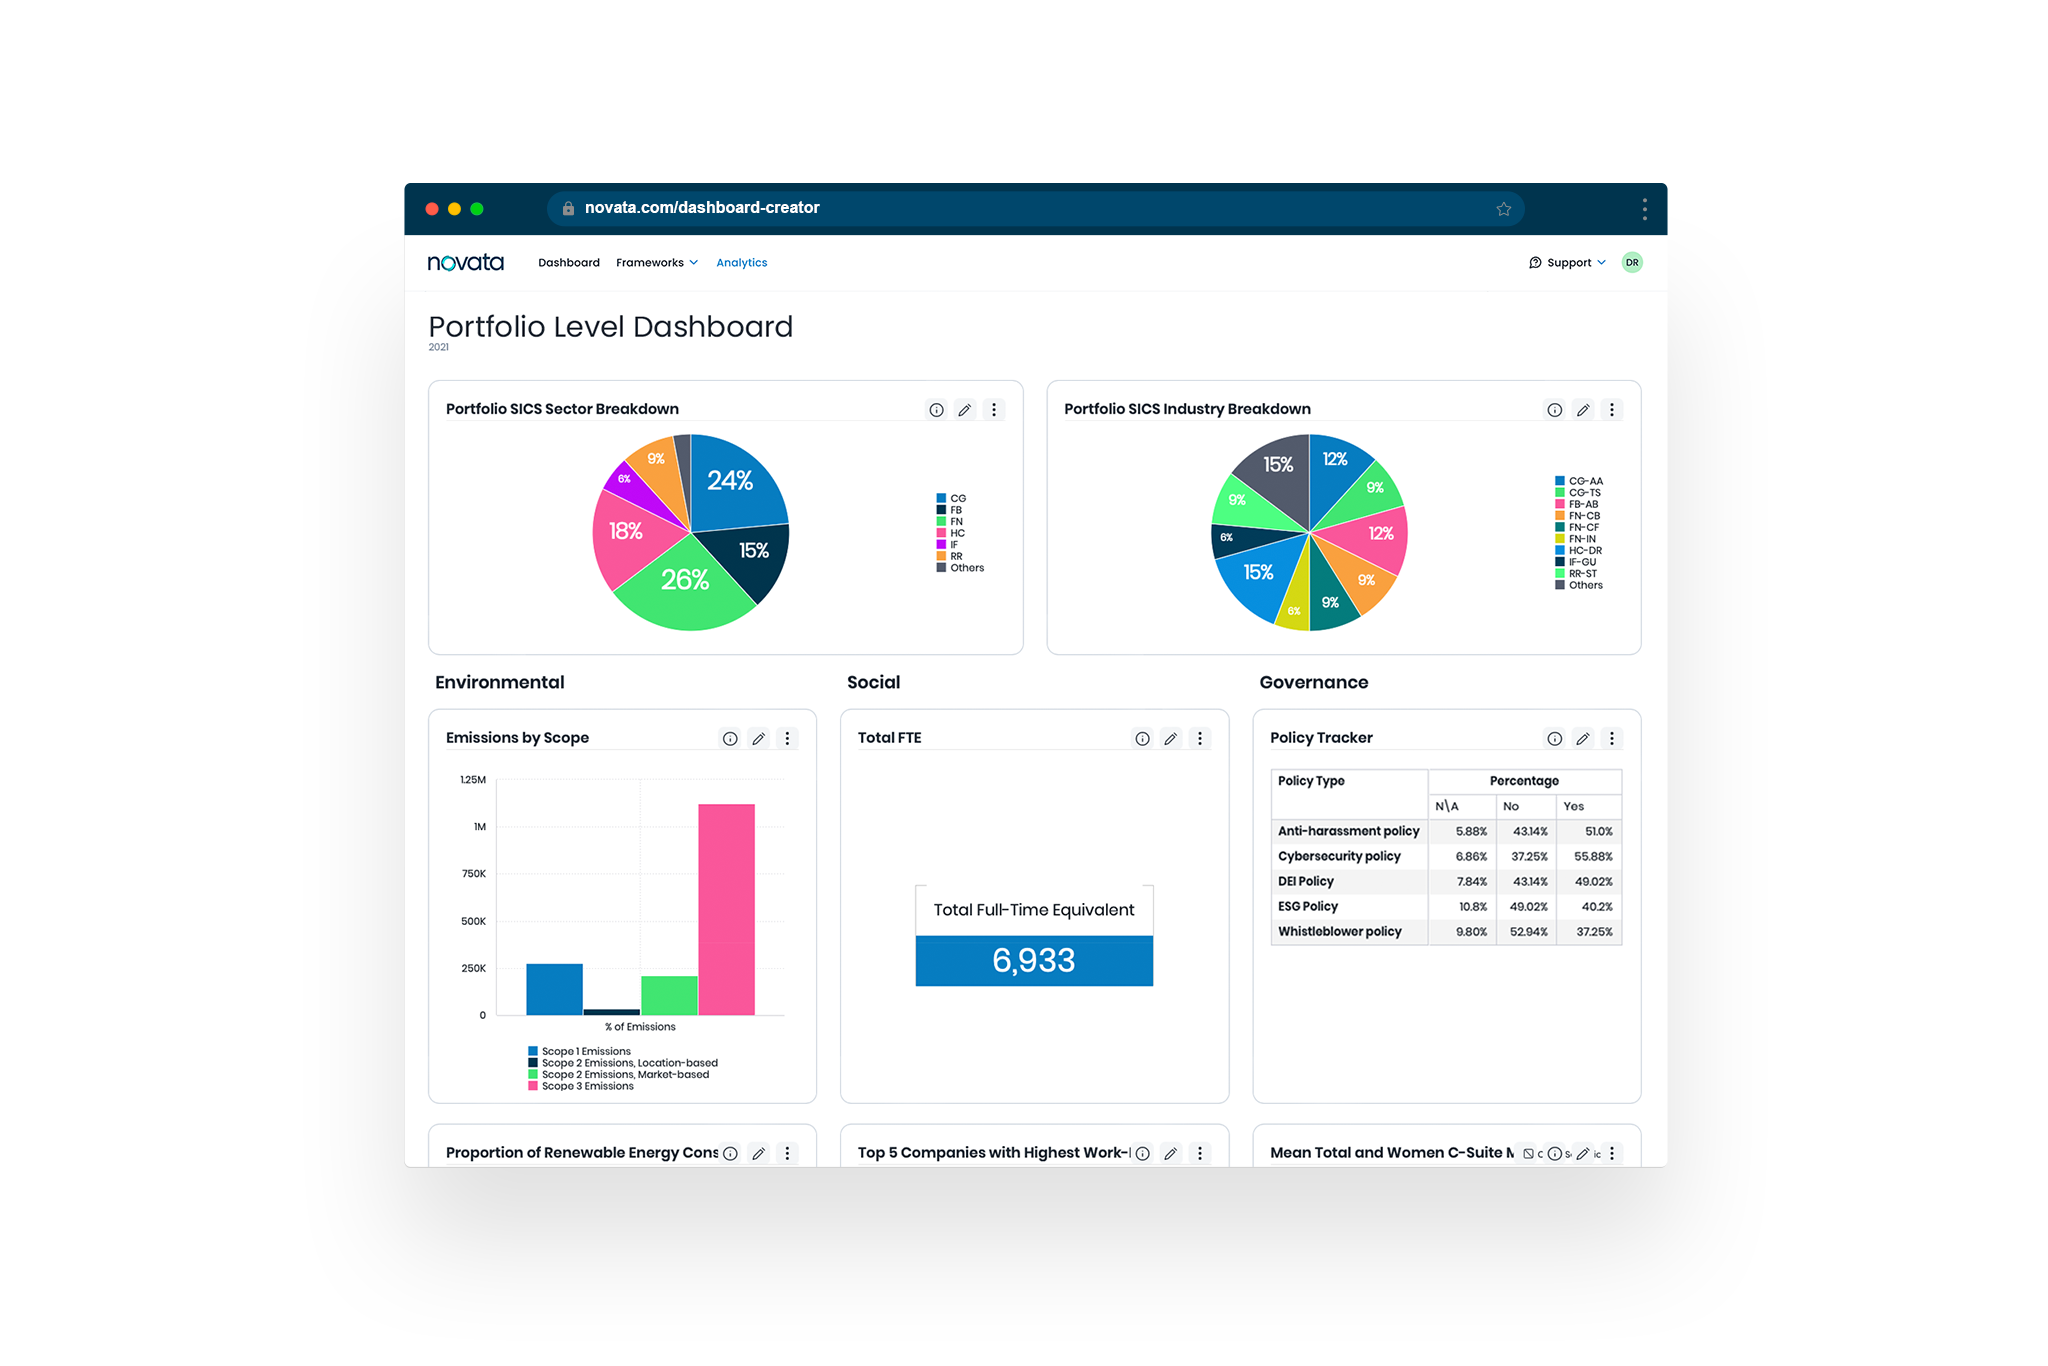
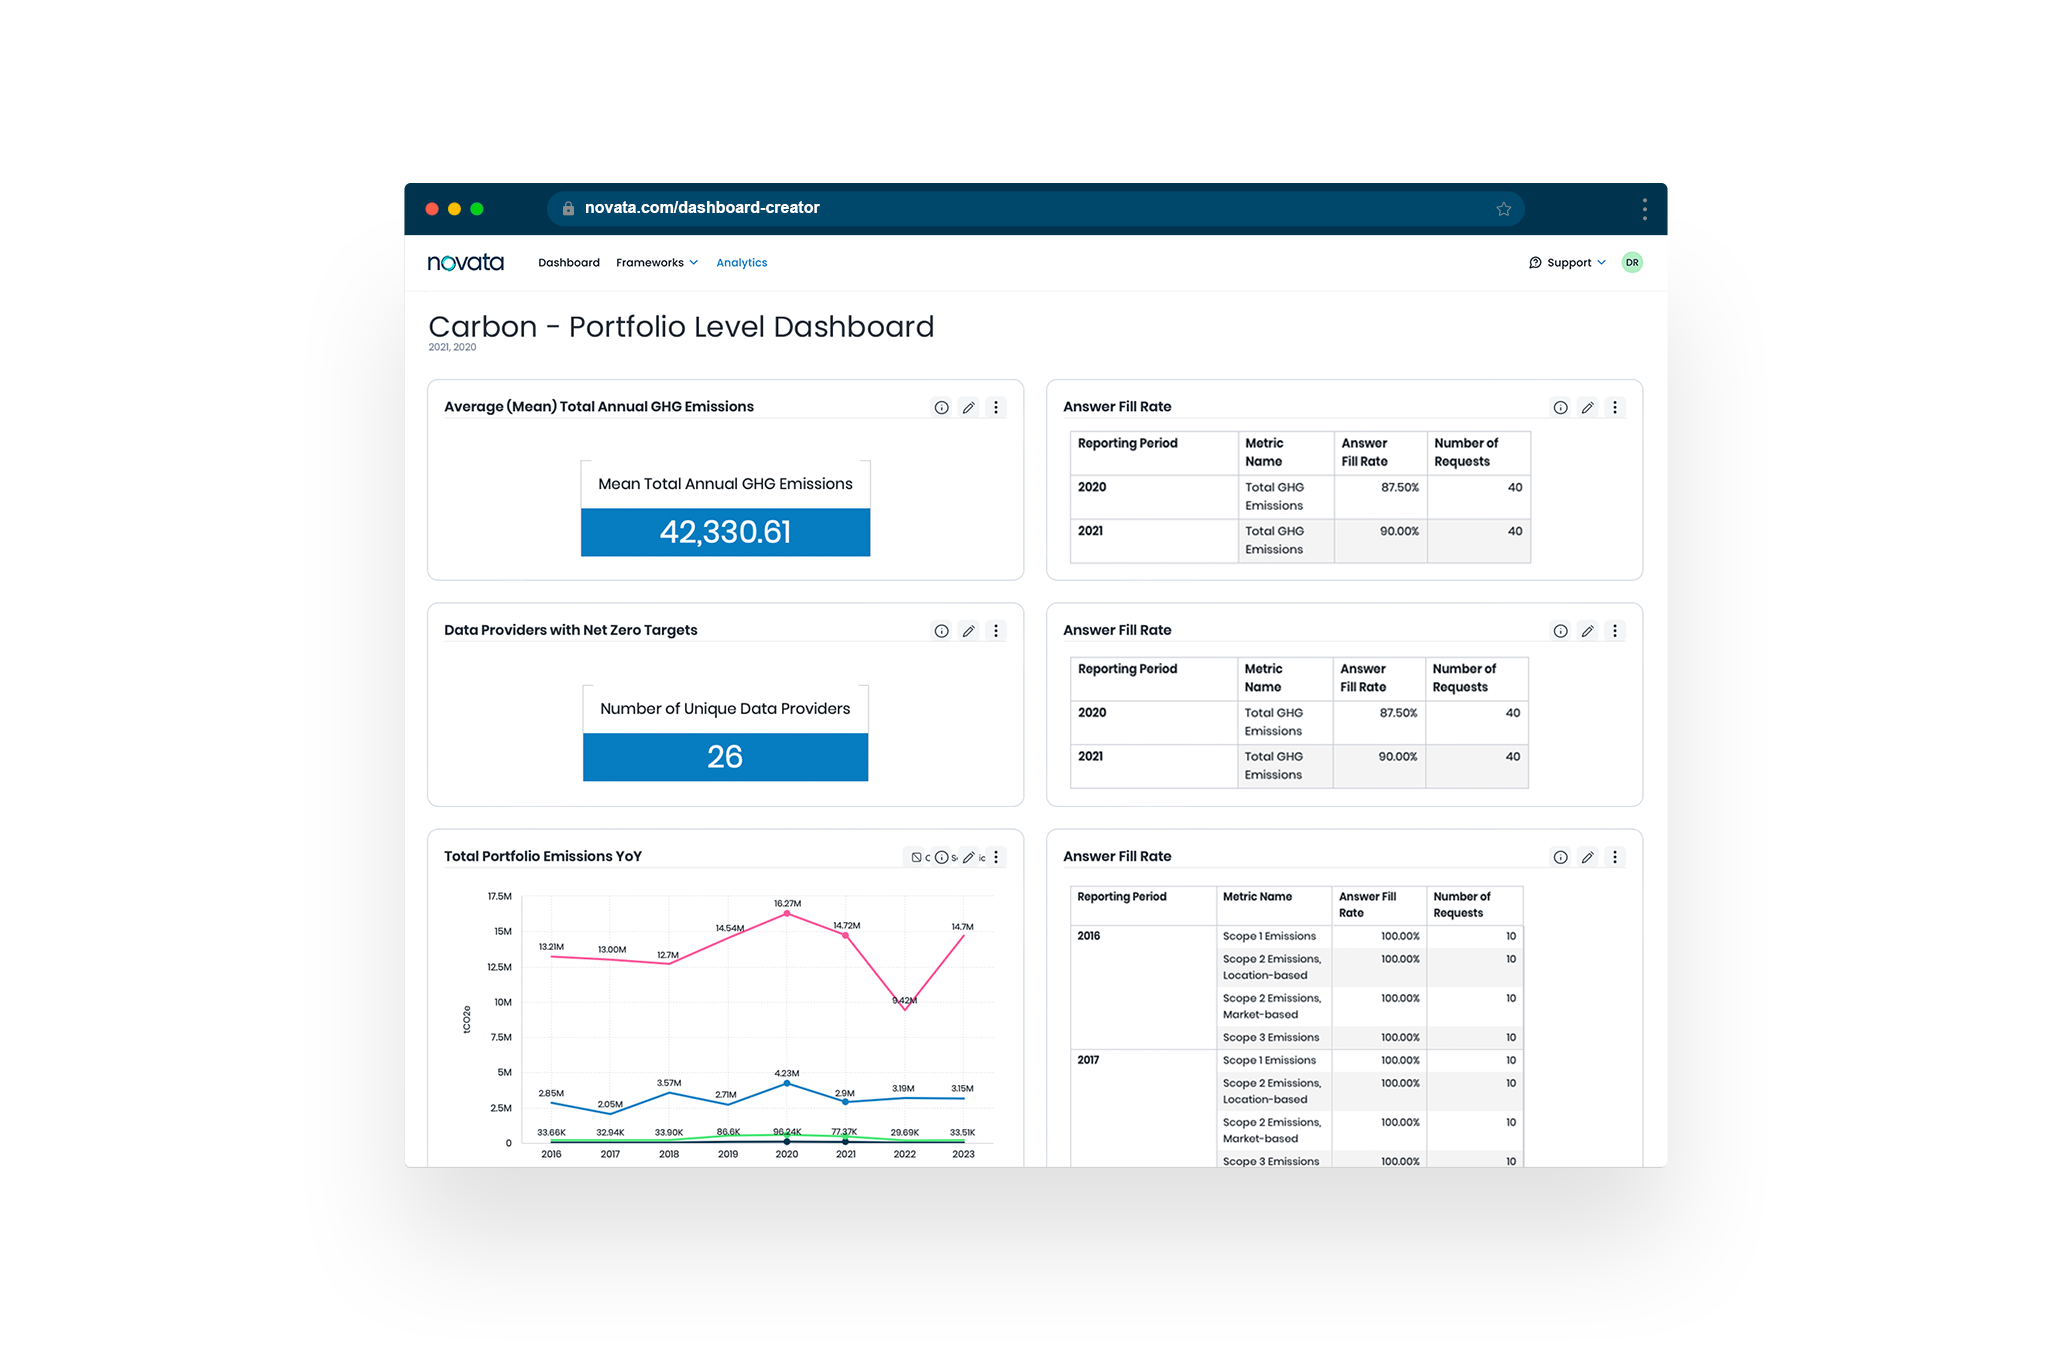
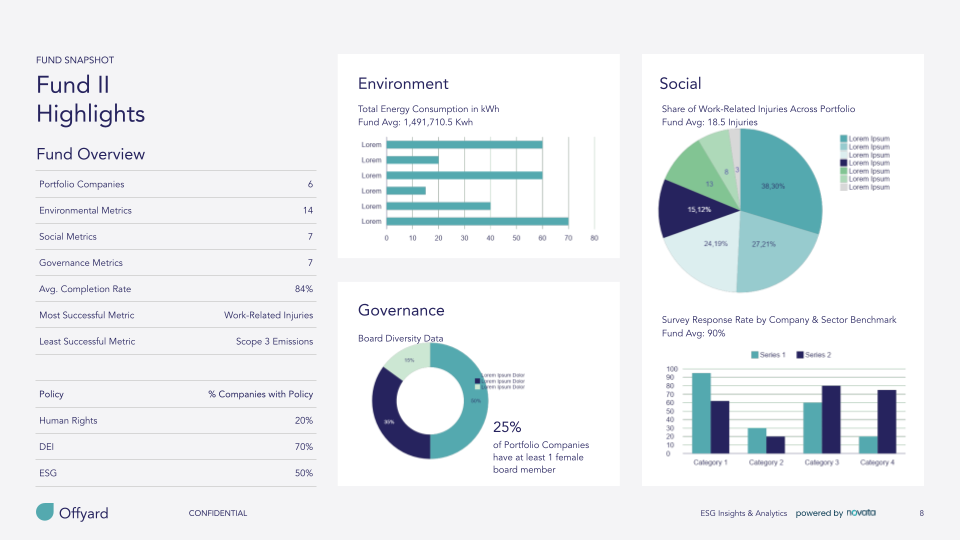
- Analytics & ReportingAnalytics and dashboards to share data and insights with stakeholders
- BenchmarkingPerformance comparisons against peers or industry
- Data StrategyStandards and analytics to integrate ESG across the investment lifecycle
- Regulatory ServicesCreate a strategic approach for required disclosures like SFDR and CSRD
- Sustainability ReportingTranslate your data into a compelling narrative for a variety of stakeholders
- Carbon ManagementMeasure and report emissions, and develop strategies to manage carbon
- Onboarding & SupportCustomer success, onboarding, and guidance to enhance the user experience
- Solutions
- For Investors
- For Companies
-
Maximize your investment in ESG with Novata advisory services.
Learn More →
- Resources
- Learn
-
Search our collection of resources covering a variety of ESG themes.
SEARCH OUR RESOURCE LIBRARY →
- About
- People
-
Our mission is to empower private markets to achieve a more sustainable and inclusive form of capitalism.
Learn More →
- FOR INVESTORS
- FOR COMPANIES
-
Novata's platform, services, and flexible features cover you at every stage of your ESG journey.
Learn More →
SUGGESTED SEARCHES
