
Scope 3 emissions are the indirect greenhouse gas (GHG) emissions that occur across a company’s entire value chain, both upstream from suppliers and purchased goods and downstream from the use and disposal of products sold, rounding out the three scopes that make up a company’s full carbon footprint.
The GHG Protocol’s Corporate Value Chain Standard defines them across 15 categories, and they are usually the largest part of an organization’s total carbon footprint.
This guide introduces all 15 Scope 3 categories, how to measure and report value-chain emissions, common challenges to expect, strategies to reduce them, and why financed emissions matter most for private market investors.
Novata’s carbon accounting guide walks through how Scope 3 fits alongside Scope 1 and Scope 2 in more depth.
Why Scope 3 emissions matter for businesses and investors
A company that only measures Scope 1 and Scope 2 is looking at a fraction of its carbon footprint. Scope 3 represents more than 70% of total carbon footprint for most organizations, and leaving it unmeasured creates blind spots across the value chain, making it harder to respond to Limited Partner (LP) data requests or identify where emissions reductions can have the greatest impact.
“Without Scope 3 data, investors cannot pinpoint where climate exposure is highest across a portfolio or where engagement will move the needle most.”
Brett Juliano, Head of Sustainability, THL Partners | Scope 3 in Private Markets webinar
LP and investor demand for Scope 3 data is intensifying
LPs, the ESG Data Convergence Initiative (EDCI), and institutional investors are pushing for broader-coverage emissions data across portfolios, making Scope 3 a factor in how General Partners (GPs) engage portfolio companies and assess climate exposure.
Customer disclosure requirements cascade through supply chains
Large corporate buyers, including hyperscalers and public companies, increasingly require carbon data from their suppliers. One company’s Scope 3 reporting requirement becomes its supplier’s data collection obligation, and companies in the middle market that cannot respond to these requests risk losing key customer relationships.
Value-chain emissions hold the largest absolute reduction opportunity
Due to how Scope 3 represents the majority of most carbon footprints, it is where the largest absolute emission reductions live, even though those reductions require collaboration across the value chain rather than operational changes within a single company.
Regulators increasingly require material Scope 3 disclosure
The EU’s CSRD and California’s SB 253 require Scope 3 emissions disclosure for companies within scope, while IFRS S2 requires disclosure of Scope 3 emissions in accordance with the GHG Protocol, subject to materiality. While recent regulatory changes have narrowed the number of companies directly subject to some requirements, Scope 3 remains an important component of major climate disclosure frameworks.
What are the 15 Scope 3 emission categories?
The GHG Protocol divides Scope 3 into eight upstream categories (linked to what a company buys) and seven downstream categories (linked to what it sells). Not every category applies to every business.
| Category | Up / down | Examples | |
|---|---|---|---|
| 1 | Purchased goods and services | Upstream | Raw materials, components, services bought |
| 2 | Capital goods | Upstream | Machinery, buildings, equipment |
| 3 | Fuel- and energy-related activities | Upstream | Emissions not in Scope 1 or 2 (e.g. T&D losses) |
| 4 | Upstream transportation & distribution | Upstream | Inbound logistics, third-party freight |
| 5 | Waste generated in operations | Upstream | Disposal and treatment of operational waste |
| 6 | Business travel | Upstream | Flights, hotels, rail for employees |
| 7 | Employee commuting | Upstream | Travel between home and work; remote work |
| 8 | Upstream leased assets | Upstream | Assets the company leases (as lessee) |
| 9 | Downstream transportation & distribution | Downstream | Outbound logistics to customers |
| 10 | Processing of sold products | Downstream | Further processing by third parties |
| 11 | Use of sold products | Downstream | Emissions when customers use the product |
| 12 | End-of-life treatment of sold products | Downstream | Disposal / recycling of products sold |
| 13 | Downstream leased assets | Downstream | Assets the company owns and leases out (lessor) |
| 14 | Franchises | Downstream | Emissions from franchise operations |
| 15 | Investments | Downstream | Financed emissions from portfolio companies – critical for investors |
Table 1: The 15 Scope 3 emission categories under the GHG Protocol
Which scope 3 emission categories dominate by business type
Purchased Goods and Services, Use of Sold Products, and Investments each dominate for different business types, based on industry benchmarks in Novata’s Scope 3 Quick Start Guide:
- Manufacturers and retailers: Category 1 (Purchased Goods and Services) often dominates, relevant to 75–90% of companies.
- Companies whose products consume energy during use (vehicles, appliances, equipment): Category 11 (Use of Sold Products) can be the single largest source.
- Investors and lenders: Category 15 (Investments) is the decisive one. Financed emissions associated with a portfolio will typically exceed any firm’s own operational footprint.
How to determine which scope 3 emission categories are material
In Novata’s Scope 3 in Private Markets webinar, Steve Cain, Senior Manager on the Novata Advisory team, pointed to a common working threshold used across frameworks like CDP, the Global Reporting Initiative (GRI), and the Science Based Targets initiative (SBTi): roughly 5–10%.
If a category contributes that much or more to total emissions, it’s likely material enough to measure. However, companies tend to gravitate toward categories that feel intuitively important, like business travel, instead of those that drive the largest share of emissions, like Purchased Goods and Services.
Research from the same webinar found that companies reporting through the Novata Carbon Navigator usually measured about three out of 15 categories, and those choices were not always the most material ones.
What makes Scope 3 emissions so hard to measure?
The emissions data needed to calculate Scope 3 sits with suppliers and customers who may not measure it themselves, making early estimates inherently reliant on industry averages and proxy data.
Supplier data is often limited or unavailable
Smaller suppliers may not have emissions data readily available, or may calculate their data using different methodologies. As a result, their early Scope 3 estimates may lean heavily on spend-based proxies. These proxies are useful for identifying hotspots but less precise than activity-based measurements.
Over time, the goal is to replace proxies with primary data from the suppliers responsible for the largest share of emissions.
Double counting is built into the system
Overlap between companies’ inventories is expected. One company’s Scope 3 may overlap with another company’s Scope 1 or 2 emissions. For example, emissions from manufacturing purchased steel may fall within the buyer’s Scope 3 inventory and also the steel supplier’s Scope emissions at the same time.
This overlap is an intentional feature of the GHG Protocol rather than a calculation error. However, companies should understand these intersections when aggregating emissions or interpreting emissions across a portfolio or value chain.
Moving from estimates to primary data takes sustained effort
Spend-based estimates give you breadth to start. From there, average data sharpens the picture with industry-specific factors, while activity-based measurements, built on real quantities from your own operations or suppliers, get you the highest accuracy.
Improving Scope 3 data quality is an ongoing process, requiring stronger and more consistent supplier engagement and increasingly specific data over time. You can learn more about the reporting process in Novata’s 6 Reporting Considerations for Scope 3 Emissions.
How to measure Scope 3 emissions
You can start with a broader spend-based screening of your most material categories, then upgrade to activity-based data where accuracy matters most. The GHG Protocol’s Scope 3 Calculation Guidance provides a more in-depth methodological foundation.
1. Map your value chain to find the categories that matter
Build a high-level picture across all 15 categories using readily available data to identify which are likely material. This screening step prevents wasted effort on categories that will not move the total.
You can prioritize upstream categories first, since the data is generally easier to access. Downstream categories, like end-of-life treatment, can wait behind upstream unless reliable data is already on hand.
2. Match spend-based, average-data, or activity-based methods to each category
Three calculation methods cover different situations: spend-based for fast screening, average data when company-specific figures aren’t available yet, and activity-based for the categories where accuracy matters most. Many companies run more than one at a time, just in different categories.
| Method | How it works | Best for | Limitations |
|---|---|---|---|
| Spend-based | Multiplies amount spent by an economic emissions factor (e.g. kg CO2e per dollar) | Fast initial screening, categories where activity data is unavailable | Less precise; assumes average emissions and cannot identify specific reduction opportunities |
| Average data | Applies industry-average emissions factors when company-specific data isn’t yet available | Categories where you have some context but no primary data | Moderate accuracy; better than spend-based, less than activity-based |
| Activity-based | Multiplies actual physical quantities (kilograms, kilowatt-hours, vehicle-km) by a specific emissions factor | Material categories where accuracy matters, informing reduction strategies | Requires more granular data collection and ongoing supplier engagement |
Table 2: Spend-based, average-data, and activity-based Scope 3 calculation methods
For example, a company might use spend-based estimates across most upstream categories while using activity-based data on Category 1 and Category 6 where the data is more readily available.
3. Collect internal records first, then engage suppliers
Start with data already in your systems (financial records, procurement records, logistics invoices, utility bills), then engage suppliers for primary data on the categories that contribute the most emissions.
Request a spend report from finance, strip out salaries, rent, taxes, and financial instruments, and apply spend-based emissions factors to what remains. A Category 1 analysis often surfaces data for several other upstream categories at the same time.
4. Document assumptions, disclose methodology, and improve each cycle
Apply consistent emissions factors, record every assumption, and maintain a clear audit trail so the methodology is replicable, even if the person doing the calculations changes.
This discipline is the same starting point covered in Novata’s guide to building a carbon inventory from scratch: report your boundaries and data quality honestly, and prioritize better data collection where improved accuracy will change the total most.
Novata’s Carbon Navigator includes AI-powered spend categorization, reducing what used to take hours of manual supplier classification down to minutes.
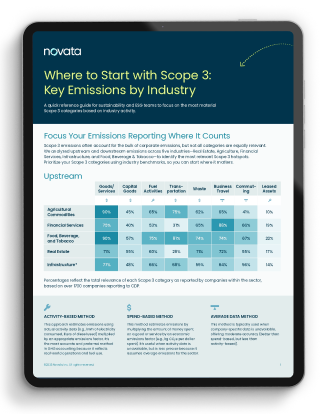
Prioritize the Scope 3 categories most material to your industry with benchmarks from over 1,700 companies.
What regulations require Scope 3 reporting?
Reporting requirements differ by company size, industry, and jurisdiction, and new thresholds and timelines continue to take effect as regulators continue to refine the regulations in place. What applies to a company in one region or sector may not apply to another, even under the same regulation.
Explore Novata’s Regulatory Navigator or see the guide to ESG regulations for the latest timelines.
Why are financed emissions critical for private market investors?
Category 15 (Investments) is the decisive Scope 3 category for private market investors because the emissions associated with portfolio companies almost always exceed a firm’s own operational footprint by orders of magnitude.
How financed emissions are measured
The Partnership for Carbon Accounting Financials (PCAF) provides the recognized measurement standard. PCAF’s methodology attributes a share of each investee’s emissions to the investor based on stake or loan size:
- Listed and unlisted equity: Emissions are attributed proportionally based on the investor’s ownership share relative to the investee’s total equity plus debt.
- Business loans and private credit: Emissions are attributed based on the outstanding loan amount relative to the investee’s total equity plus debt.
GPs in private equity and private credit should apply PCAF’s guidance for unlisted equity and business loans, the specific walkthrough covered in Novata’s financed emissions guide.
Why comparable portfolio data matters
The practical challenge is collecting comparable emissions data across a portfolio of companies, many of which may be measuring carbon for the first time. Industry data standards like the EDCI exist to address this.
Without standardized inputs from portfolio companies, financed-emissions reporting is hard to benchmark or act on, which is why Novata’s investor sustainability solutions build on those standards to support portfolio-level reporting.
Novata’s in-house carbon advisory team works directly with investors and companies to calculate, analyze, and report value-chain and financed emissions with confidence.
How to reduce Scope 3 emissions
Concentrate reduction efforts on your most material categories, then work outward through supplier engagement, procurement criteria, and product design. Because the emissions base is so much larger than Scopes 1 and 2, even incremental improvements in high-impact categories produce substantial absolute reductions.
Target the categories driving the largest share of emissions
Most companies should start with Purchased Goods and Services (Category 1). Depending on the business model, Use of Sold Products (Category 11) or Upstream Transportation and Distribution (Category 4) may be equally significant.
Engage suppliers on data and reduction plans
Prioritize data collection from the suppliers that contribute the most emissions, work toward primary (activity-based) data on key inputs, and build emission reduction expectations into vendor review processes.
Build emissions criteria into procurement decisions
Incorporating emissions performance into supplier selection and contract renewal criteria ensures that buying decisions reflect climate goals over time.
Design products for lower lifecycle emissions
Companies where Category 11 (Use of Sold Products) or Category 12 (End-of-life Treatment) are material should treat product design as the primary lever through energy efficiency improvements, material substitution, and design-for-recyclability.
Set clear and measurable carbon reduction targets
A reduction target works best with a number and a deadline, benchmarked against a recognized climate pathway such as the Paris Agreement’s goal to limit warming to 1.5°C. Setting that kind of target doesn’t require external validation, which makes it a proportionate starting point for companies at any stage of their Scope 3 work.
Companies ready to pursue formal external recognition can seek validation through the SBTi, widely regarded as the gold standard. That formal process involves a public commitment, third-party verification, and associated fees, so it functions best as a next step rather than a starting requirement. Under SBTi’s criteria, a Scope 3 target is required once value-chain emissions reach 40% or more of a company’s total, a threshold most organizations exceed.
Turn Scope 3 measurement into a lasting advantage
The commercial pressure behind Scope 3, from LPs, customers, and portfolio risk, isn’t going away. However, companies and investors can choose how to respond, and those that start with an imperfect estimate are taking the first steps to build the data, supplier relationships, and internal fluency to report with confidence as expectations rise.
Frequently asked questions
Scope 3 emissions are the indirect greenhouse gas emissions across a company’s value chain, covering both upstream sources (suppliers and purchased goods) and downstream sources (the use and disposal of products sold). The GHG Protocol defines them across 15 categories, and they’re usually the largest part of a company’s footprint.
The GHG Protocol’s Scope 3 Standard sets out 15 categories: eight upstream (such as purchased goods, business travel, and employee commuting) and seven downstream (such as use of sold products, end-of-life treatment, and investments). Companies report on the categories relevant and material to their business.
Scope 1 is direct emissions from sources a company owns or controls; Scope 2 is indirect emissions from purchased energy; Scope 3 is all other indirect emissions across the value chain. See our carbon accounting guide for the full picture.
Start by identifying which Scope 3 categories are relevant and most significant to your business. Many companies start by reporting about three to five categories, focusing where emissions contribute 5% or more to the total. You can add immaterial categories in later reporting cycles.
Scope 3 makes up the majority of total emissions for most organizations, often the large majority, so it holds both the biggest climate risk and the biggest reduction opportunity. It’s also increasingly required by regulators and expected by investors and large customers.
Start by screening your value chain to find material categories, then choose a method per category — spend-based (cost × emissions factor) for a quick estimate, or activity-based (actual quantities × factor) for accuracy. Collect supplier data for your most material categories and improve the data over time.
You will need a company-wide spend report with salaries, rent, and taxes stripped out to run your first spend-based estimate on Category 1. Energy consumption data, travel records, and logistics invoices help cover additional upstream categories.
Spend-based estimates are widely accepted for early-stage Scope 3 reporting under the GHG Protocol. Regulators and frameworks expect data quality to improve over time, with a gradual transition toward activity-based methods on the most material categories.
You can start with the suppliers contributing the most spend or emissions. Use industry benchmarks to frame the conversation, and begin with data you already collect through procurement (weights, quantities, materials) before requesting their calculated emissions figures.
Requirements vary by jurisdiction: the EU’s CSRD and California’s SB 253 require material Scope 3 disclosure, the ISSB’s IFRS S2 expects it, and the US SEC’s climate rule excluded it entirely.
Rising totals can reflect that your data coverage or methodology improved, not that performance got worse. CSRD and SBTi both expect that kind of refinement year over year, so documenting what changed reads as reporting maturity rather than backsliding.
Target your material categories first, engage suppliers on data and reduction plans, build emissions into procurement and product design, and set science-based targets. Since Scope 3 emissions are indirect, most of this work happens through collaboration across the value chain rather than internal changes alone.
Financed emissions refer to the GHG emissions tied to a financial institution’s loans and investments, classified as Scope 3 Category 15. They typically exceed an investor’s own operational emissions by orders of magnitude. The PCAF standard provides the measurement methodology.
Start measuring Scope 3 emissions with the right tools
Novata’s Carbon Navigator and carbon advisory team help private market investors and companies measure and report value-chain and financed emissions, from first screening to assured disclosure.